Modern applications increasingly rely on Serverless technologies such as Amazon Web Services (AWS) Lambda to provide scalability, cost efficiency, and agility. The Serverless Applications Lens for the AWS Well-Architected Framework focuses on how to design, deploy, and architect your Serverless applications to overcome some of these challenges.
Powertools for AWS Lambda is a developer toolkit that helps you implement Serverless best practices and directly translates AWS Well-Architected recommendations into actionable, developer friendly utilities. Following the community’s continued successful adoption of Powertools for AWS in Python, Java, TypeScript, and .NET, this post announces the general availability of Powertools for AWS Lambda (Java) v2 coming with major performance improvements, enhanced core utilities, and a brand-new Kafka utility.
Powertools for AWS (Java) v2 provides three updated core utilities:
- Logging: A re-designed Java idiomatic logging module providing structured logging that streamlines log aggregation and analysis.
- Metrics: An improved metrics experience allowing custom metrics collection using CloudWatch Embedded Metric Format (EMF).
- Tracing: An annotation-based way to collect distributed tracing data with AWS X-Ray to visualize and analyze request flows.
Along with the updated core utilities, v2 of the developer toolkit adds two brand new features:
- GraalVM native image support: Native image support for GraalVM across all core utilities reducing Lambda cold start times up to 75.61% (p95).
- Kafka utility: This new utility integrates with Amazon Managed Streaming for Apache Kafka (Amazon MSK) and self-managed Kafka event sources on Lambda and allows developers to deserialize directly into Kafka native types such as ConsumerRecords.
Learn more about how to migrate to v2 in our upgrade guide.
Getting started using Powertools for AWS Lambda (Java) v2
Powertools for AWS Lambda (Java) v2 is readily accessible as a Java package on Maven Central and integrates with popular build tools such as Maven and Gradle. This post focuses on Maven-based implementation samples to help you get started quickly. Gradle examples are available for all utilities in the documentation and the examples repository.
The toolkit is compatible with Java 11 and newer versions, making sure you can use modern Java features while building Serverless applications. Examples on how to install each utility are outlined in each section of the post and complete configuration examples are also available in the Powertools documentation.
Logging
The Logging utility helps implement structured logging when running on Lambda while still using familiar Java logging libraries such as slf4j, log4j, and logback. v2 of Logging allows you to do the following:
- Output structured JSON logs enriched with Lambda context
- Choose the logging backend of your choice among
log4j2andlogback - Add structured arguments to logs that get serialized into arbitrarily nested JSON objects
- Add global log keys using the
slf4jdefault Mapped Diagnostic Context (MDC)
To add the logging utility to your project, include it as a dependency in your Java Maven project. The following example shows how to add the log4j2 logging backend to your application:
Create a custom JsonTemplateLayout appender in your log4j2.xml file:
To add structured logging to your functions, apply the @Logging annotation to your Lambda handler and use the familiar slf4j Java API when writing log statements. This allows you to adopt the logging utility without major code refactoring. Powertools handles routing to the correct logging backend for you. The following example shows how to add global log keys using MDC, and add a structured entry argument to your log message:
Lambda sends the following JSON-formatted output to Amazon CloudWatch Logs (note how the Java Map gets auto-serialized into a JSON object):
Metrics
CloudWatch offers essential built-in service metrics for monitoring application throughput, error rates, and resource usage. Users also need to capture workload specific custom metrics relevant to their business use-case following AWS Well-Architected best-practices.
Powertools for AWS (Java) enables you to create custom metrics asynchronously by outputting metrics in CloudWatch EMF directly to standard output—an approach that needs no other configuration. The Lambda service sends the EMF formatted metrics to CloudWatch on your behalf.
The Metrics utility allows you to:
- Create custom metrics asynchronously using CloudWatch EMF
- Reduce latency by avoiding synchronous metric publishing
- Automatically track cold starts in a custom CloudWatch metric
- Avoid manually validating your output against the EMF specification
- Keep you code clean by avoiding manual flushing to standard output
To add the Metrics utility to your project, add the following Maven dependency:
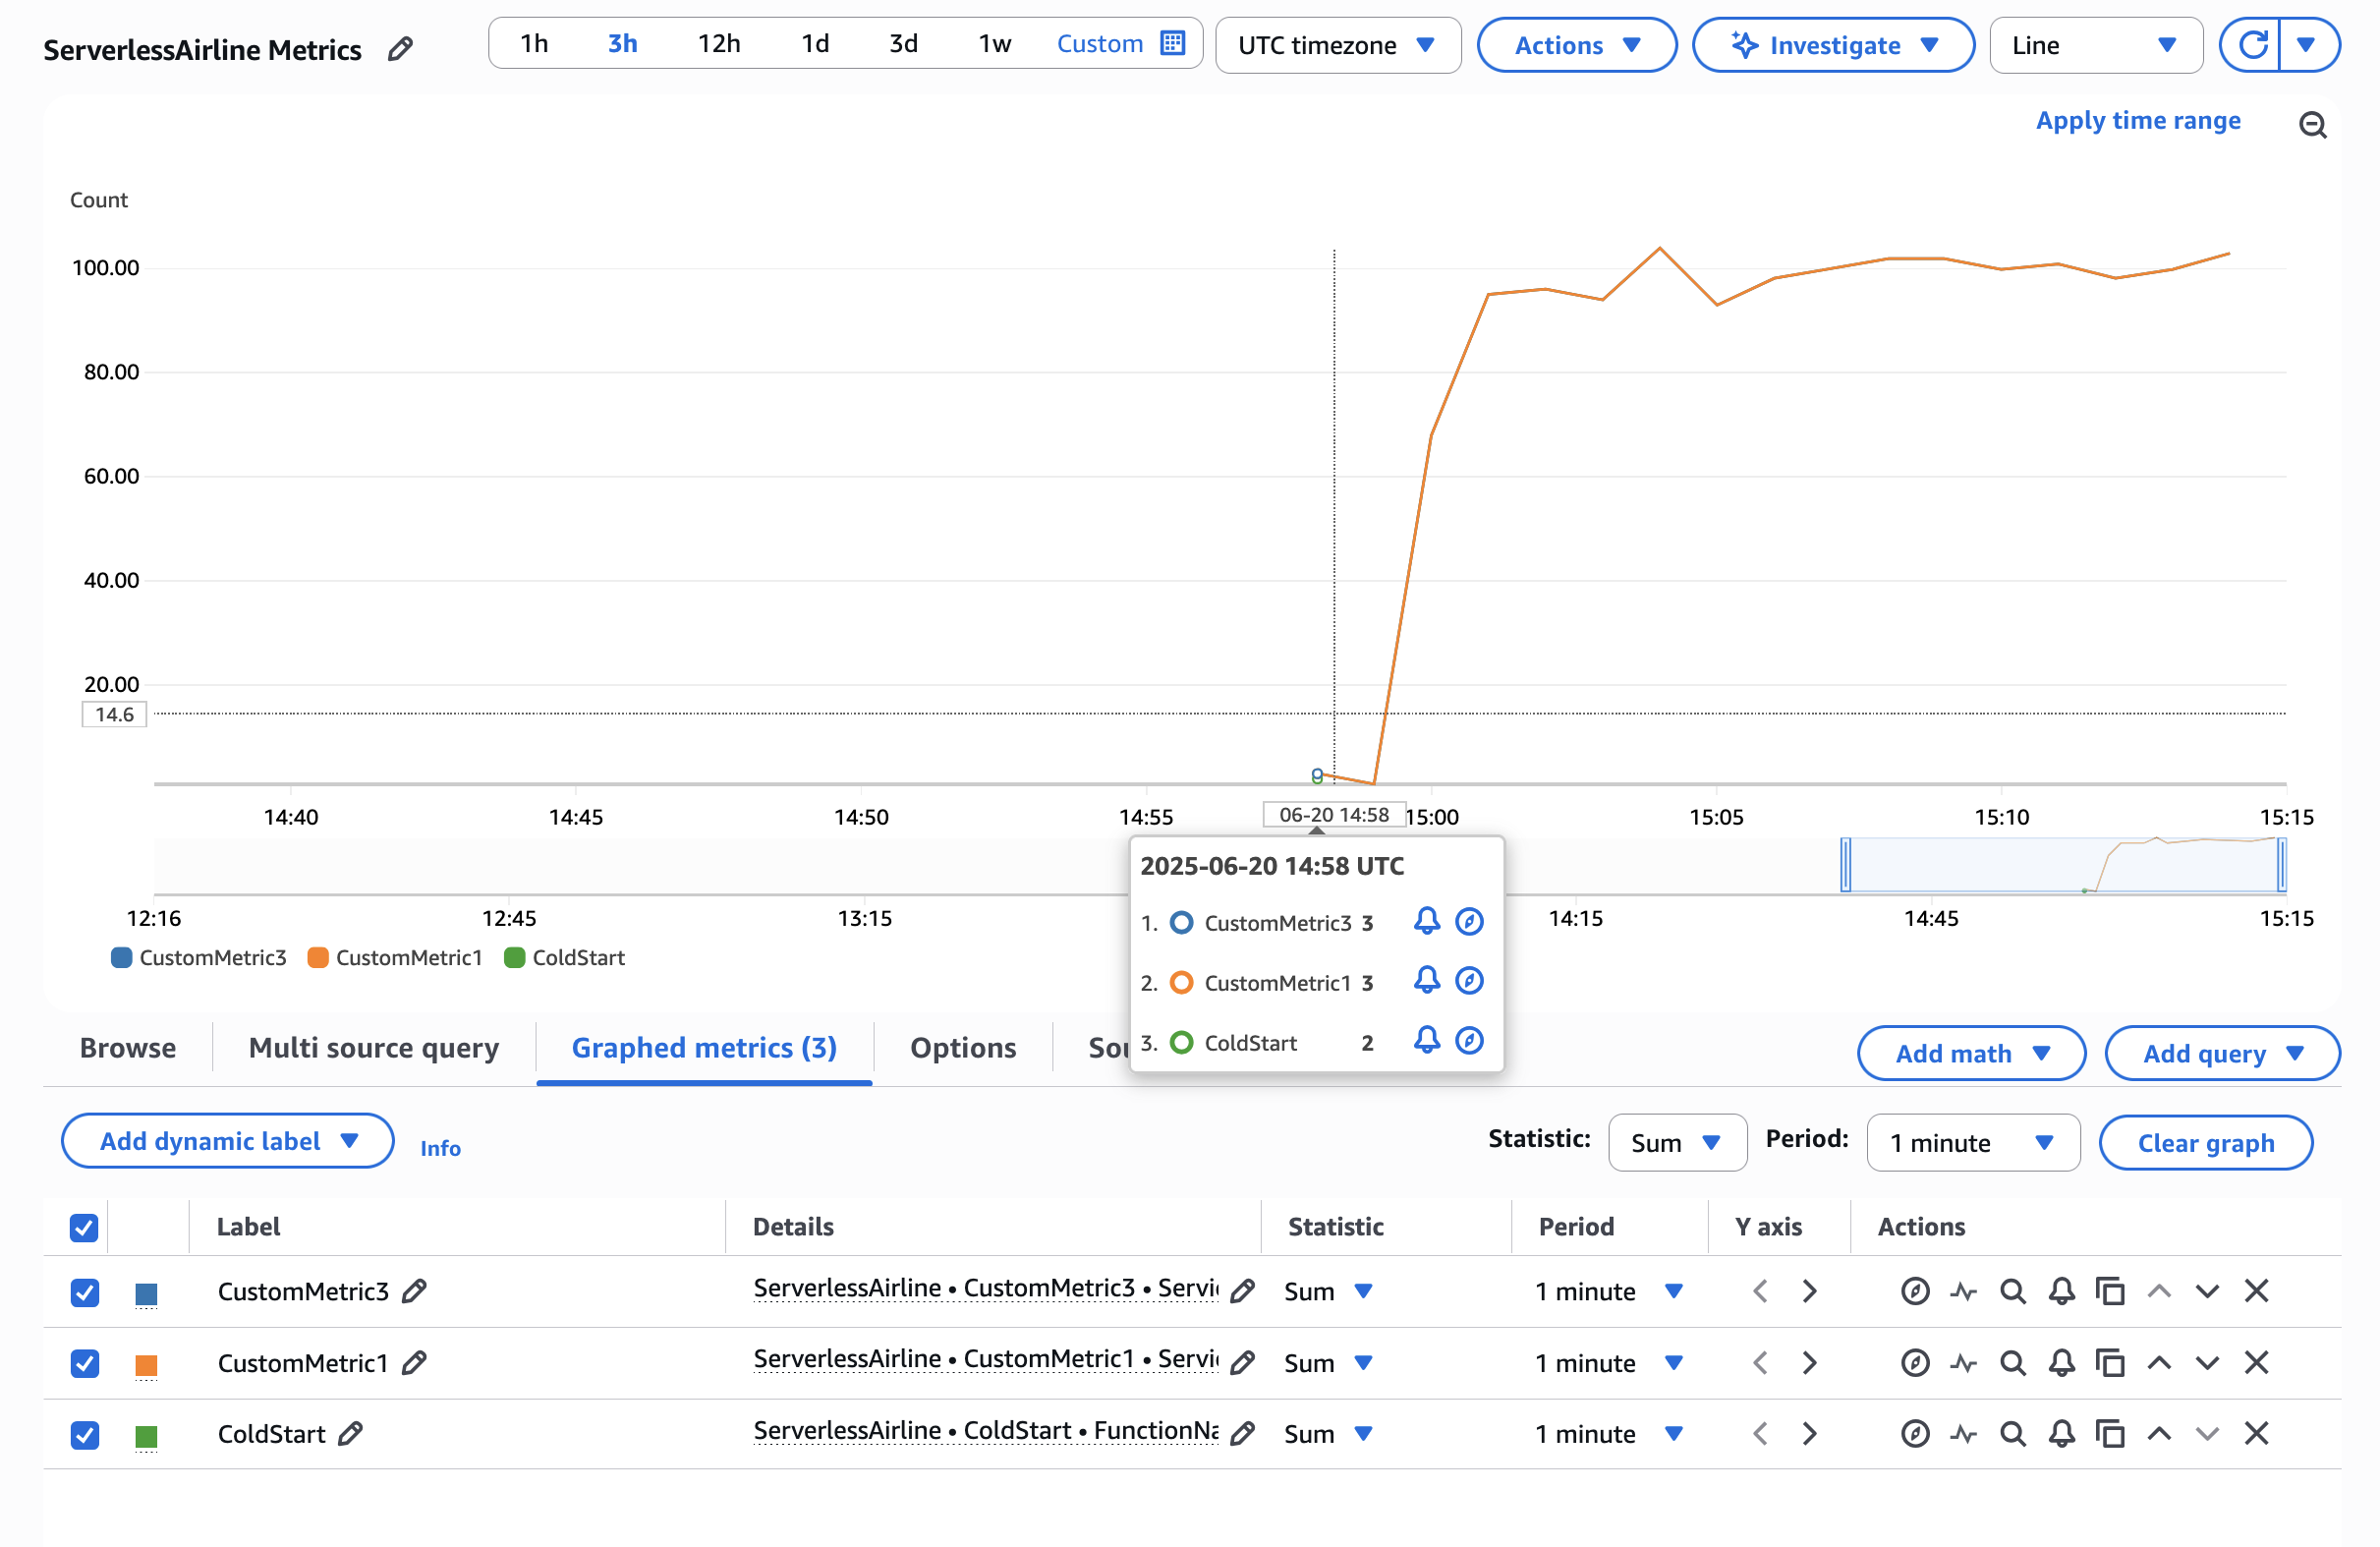
To add custom metrics to your Lambda function, place the @FlushMetrics annotation on your Lambda handler. The library takes care of validating and flushing your metrics to standard output before the Lambda function terminates. The following example shows how you can automatically capture a cold start metric and emit your own custom metrics:

Figure 1. AWS CloudWatch Metrics Graph View
Tracing
The Tracing utility provides an annotation-based integration with X-Ray for distributed tracing with minimal configuration. Tracing allows you to:
- Gain visibility into your own methods calls and AWS service interactions visualized in the X-Ray console
- Automatically capture method responses and errors
- Automatically capture Lambda cold start information as part of your traces
- Add custom metadata to traces for more context and debugging information
- Enable or disable tracing features through environment variables without code changes
To add the Tracing utility to your project, add the following Maven dependency:
To enable tracing in your Lambda function, annotate your Lambda handler and your custom methods that you want to trace with the @Tracing annotation. Each annotation maps to a sub-segment of your main Lambda handler in X-Ray and becomes visible in the console.
The X-Ray console displays a generated service map when traffic begins flowing through your application. Applying the Tracing annotation to your Lambda function handler method or any other methods in the execution chain provides you with comprehensive visibility into the traffic patterns throughout your application. The following figure shows how the custom metadata added in the example is associated with the custom sub-segment.
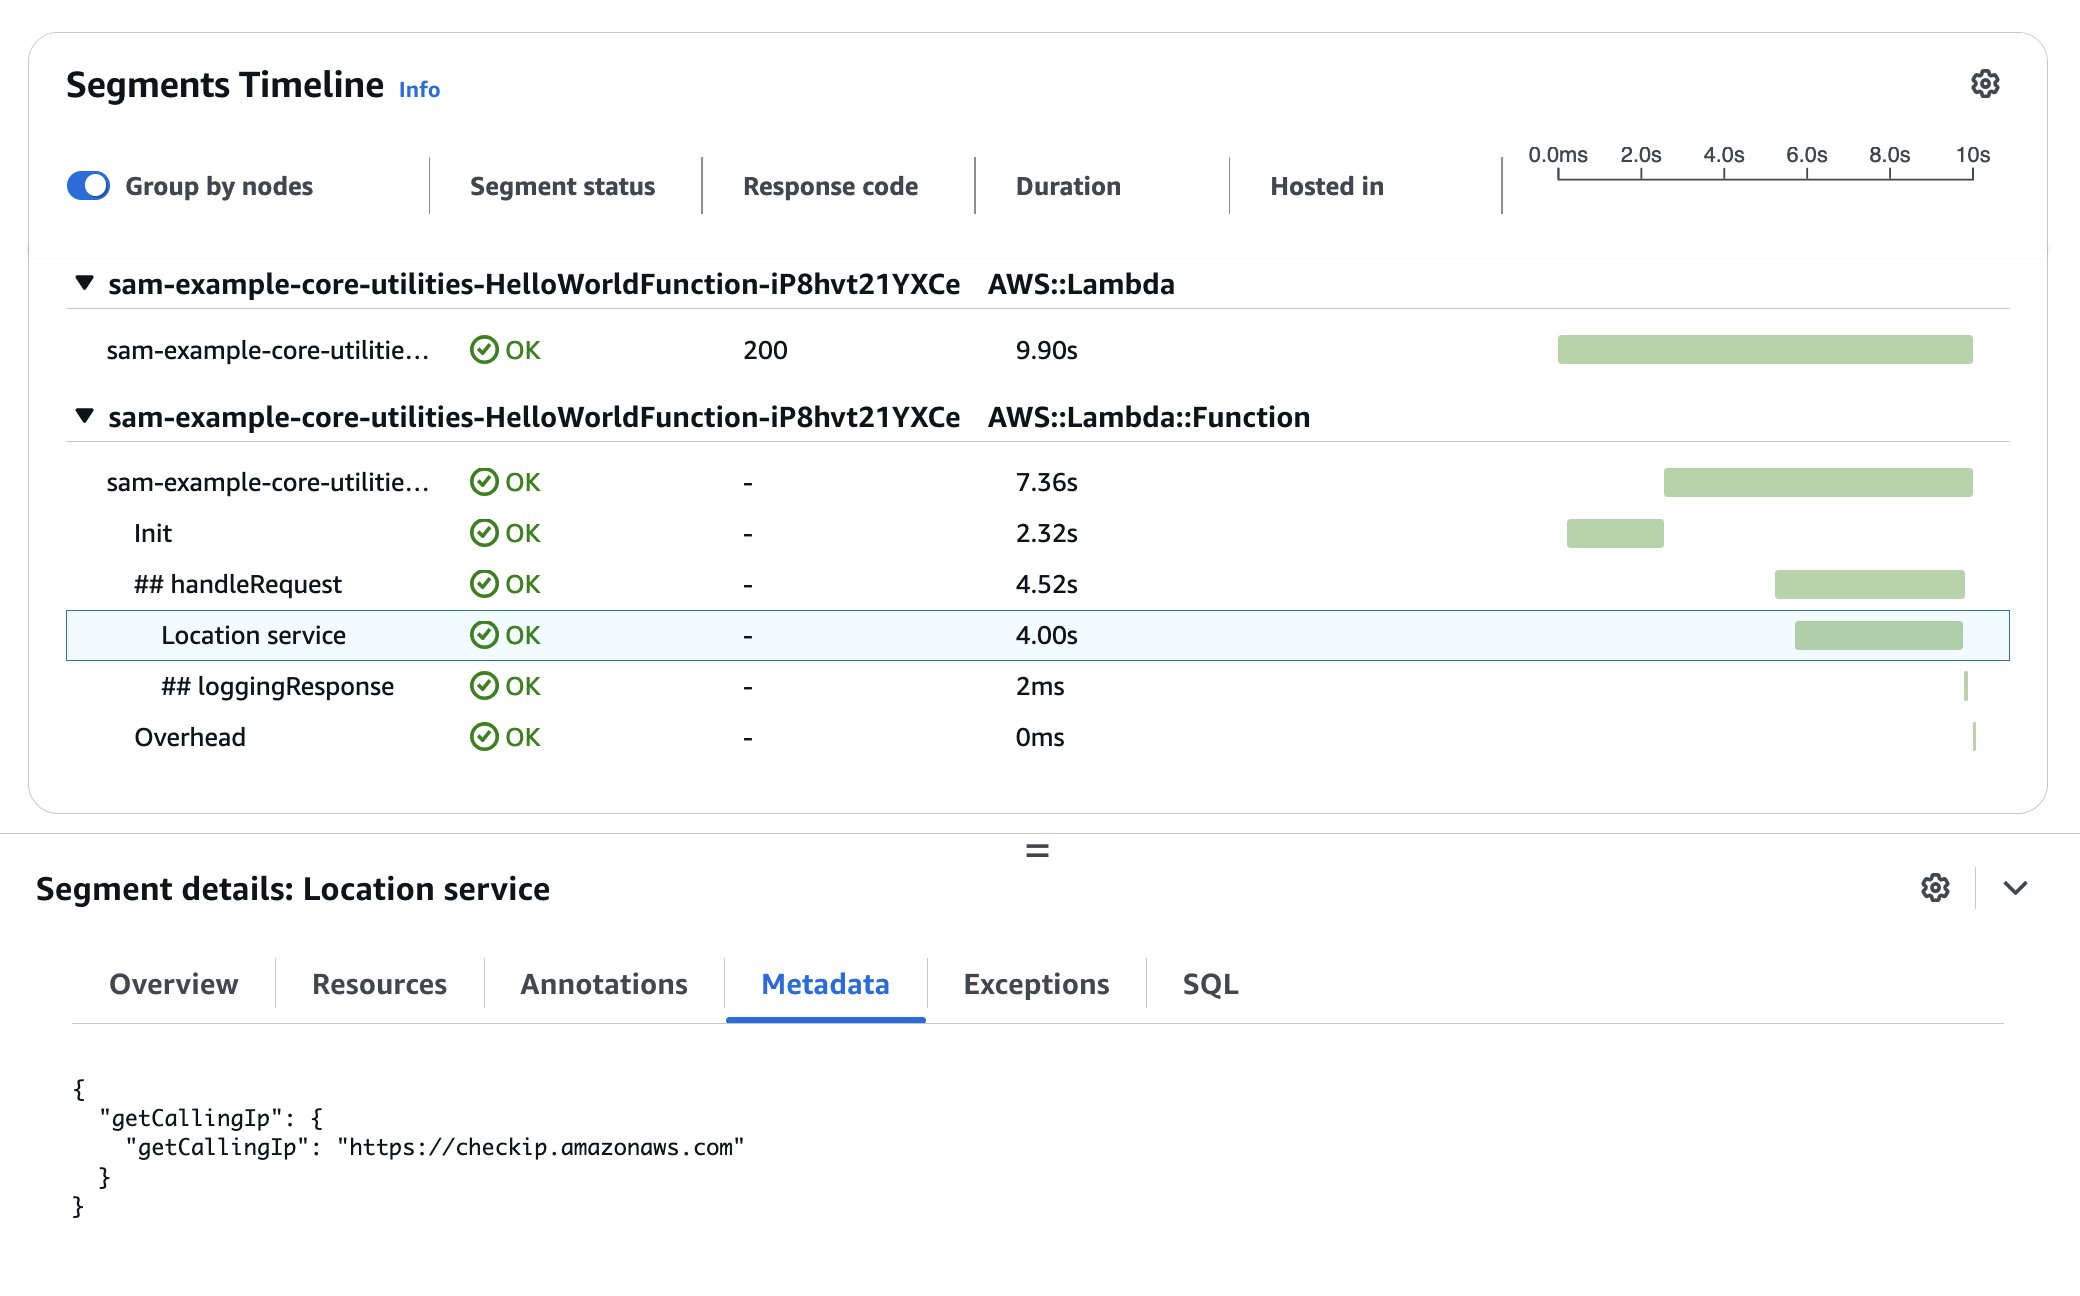
Figure 2. AWS X-Ray waterfall trace view
Reducing Lambda cold start duration
A key feature in Powertools for AWS Lambda (Java) v2 is GraalVM native image support for all core utilities. Compiling your Lambda functions to native executables allows you to significantly reduce cold start times and memory usage. Using Powertools v2 with GraalVM allows you to reduce cold starts up to 75.61% (p95) compared to using the managed Java runtime. The following benchmark compares the cold start times of an application using all core utilities (logging, metrics, tracing) on the managed java21 runtime as compared to the Lambda provided.al2023 runtime running a GraalVM compiled native image (go to the supported Lambda runtimes):
| Environment | p95 (ms) | Min (ms) | Avg (ms) | Max (ms) | Max Memory (MB) | N |
| Powertools for AWS (Java) v2: JVM | 1682.92 | 1224.55 | 1224.55 | 2229.81 | 205.04 | 234 |
| Powertools for AWS (Java) v2: GraalVM | 542.86 | 404.92 | 504.77 | 752.85 | 93.46 | 369 |
This improvement is particularly valuable for latency-sensitive applications and functions that scale frequently. Check out a full working example on GitHub.
Lambda MSK Event Source Mapping Integration
The new Kafka utility introduced with Powertools for AWS Lambda (Java) v2 streamlines working with the Lambda MSK Event Source Mapping (ESM) and self-managed Kafka event sources. It provides a familiar experience for developers working with Apache Kafka by allowing direct conversion from Lambda events to Kafka’s native types. The key features include:
- Direct deserialization into Kafka
ConsumerRecords<K, V>objects while using the Lambda-nativeRequestHandlerinterface - Support for deserializing JSON, Avro, and Protobuf encoded records for key and value fields with and without usage of a Schema Registry when producing the messages
To add the Kafka utility to your project, include the powertools-kafka library as a Maven dependency in your pom.xml:
Use the @Deserialization annotation on your Lambda handler to deserialize messages as native Kafka ConsumerRecords. Make sure to specify the deserializer type. The following example shows how to deserialize Avro encoded record values with String keys. As in a regular Lambda handler, declare the input type to your function in the RequestHandler generic parameters and the utility discovers the deserialization types automatically. The AvroProduct class in the following example is an auto-generated Java class using the Java org.apache.avro.avro library.
Conclusion
Powertools for AWS Lambda (Java) v2 represents the next evolution in the toolkit for building robust, observable, and high-performing Serverless applications. Throughout this post, we’ve explored the enhanced core observability utilities with their new features, the performance gains through GraalVM native image support, and the new Kafka utility that supports using familiar Kafka patterns when working on Lambda.
Powertools also offers more utilities to handle common Serverless design patterns. Each utility is designed with the same principles of clarity and minimal overhead.To learn more:
- Visit the documentation for detailed guides and examples
- Try the sample applications
- Join the community on GitHub to share your experience and get help
Your next Serverless application awaits with Powertools for AWS Lambda (Java) v2. We would love to hear your feedback!